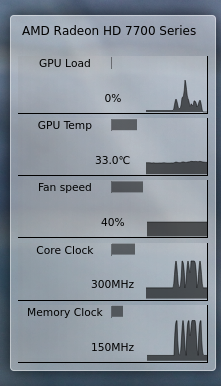
Description: This is an updated version of Ryan Ho's AtiMonitor script. It's compatible with current KDE releases, and updated with a fanspeed monitor.Last changelog:
1.0 - modern KDE compatible. 1.1 - fanspeed monitor added (thanks BubuFearn!)
As I'm overclocking my card I really needed to make sure the fan was operating at an appropriate speed.
Now I have a really nice visual indication of exacty what the gfx card is doing all the time.
I can't thank you enough :)
I'm glay you are happy :)
Currently I'm thinking about the display of vram usage, but i can't find any means to do this. Catalyst can't supply this information by itself and withouth catalyst, it may be impossible to do.
If you have an idea about this... :)
So far I've found nothing in aticonfig can do that will help us display vram, so this one will be a little tricky!
However!
We can query the info we need with:
lspci -v | grep VGA -A12
However on my system it reports:
Memory at d0000000 (64-bit, prefetchable) [size=256M]
So either I got ripped off by ASUS and they sold be a 256M card badged as a 1GB card, or lspci is misreading the info. (Probably I have 4x blocks of 256)
I will keep digging, I'm sure there is a way to do this. The 14.10 driver from their website using catalyst control centre displays it, along with the type, clock and bandwidth, so there *is* a way and they use it.
We just need to work how!
OK I have a solution.
But it may not be totaly reliable as it involves greping the Xorg.0.log file, which might be unreliable for some people...:
grep -i 'Video ram' Xorg.0.log
Returns:
[ 20.182] (--) fglrx(0): Video RAM: 1048576 kByte, Type: GDDR5
So as long as they log it. We can use it.
Give it a try on your system and let me know if you think its a reliable enough method for us to use.
Well, lspci reads some "directly mapped to cpu" vram, that's why it is display 256MB. So it's correct, just not usefull to us.
But total vram can be questioned from other sources like xorg.
There may be a way for getting dynamic usage with c code, but it's not tested yet.
Yeah I see what you mean about lspci.
I found this quote from a guy on an overclocking forum which explains the problem better than I can.
Source: http://www.techpowerup.com/forums/threads/hmm-ati-hd5xxx-memory-usage-monitor-not-possible.127140/
-----------------------
cadaveca
"Data in mem is "in flight" and as such, is not "actively" stored in mem. It requires the use of debugging tools(GPUPerfMonitor et al./virtualiztion of the app, sometimes), or custom code to find out how much is actually being used( for example, GTA4 bench will tell you % of memory was used).
Also, you must be sure to not be querying the local store, which is just 32k.
There basically is not one large 1GB data share on 1GB AMD cards. It's literally broken up into 4x256MB groupings(as the memory controller is not 256-bit, but 4x64 bit, but as they all run in tandem, it's considered 256-bit overall), making proper monitoring even more difficult. 4x data stores means it's very possible that monitoring calls may stall an app, leading to crashes. "
---------------
So according to cadaveca it seems that just by monitoring we *might* cause some applications to stall and crash.
I'm waaay out of my depth on this one :)
Just finished rebuilding my system.
Just about to install your new version now, and will let you know how it goes.
Well done for turning out some new code so fast :)
Hi,
A few questions please.
Is there any sign of the original author yet?
If he comes back do you plan to merge?
I'd like to add a reading for the fan also, is this possible/difficult?
Thanks for helping to make my desktop rock!
Hy! Thx!
So far nothing from the authotor yet...
"I'd like to add a reading for the fan also, is this possible/difficult?"
If catalyst gives back that information in terminal, than it's possible to add. I will check this but not today.
Yep it does :)
aticonfig --pplib-cmd 'get fanspeed 0'
Fan speed query:
Query Index: 0, Speed in percent
Result: Fan Speed: 41%
I've tried poking around with the code. I think I need to modify the getresult and updateTime functions. The fanspeed is reported as a percentage so I imagine the chart code there will be similar to the GPU Load one and I can re-use it for the fan?
I'm a bit of a Python noob/learner but if I can find an IDE that works I'll try and help as much as possible!
I've been using plasmate and it's preview is pretty buggy with python, so I will try kdevelop and see how that goes.
I'm a bit stuck with how to pipe the
aticonfig --pplib-cmd 'get fanspeed 0'
command via Popen on line 172 and add it to the list in order to populate a chart.
This is probably just a combination of my poor syntax escaping the quote marks 'get fanspeed 0' and/or plasmate just failing to reload the code in the preview window correctly each time I make a change.
If I can work out how the original code loops through each iteration of aticonfig and then parses the results it should then be fairly simple to add a --pplib-cmd iteration that we can use in an additional chart, either above or below the GPU Temp area.
Additionaly aticonfig --pplib-cmd can be used to set values i.e core clock speed at low,mid,high and the fan speed itself programaticaly.
I belive
http://sourceforge.net/projects/amdovdrvctrl/
uses this method to dynamicaly adjust the fan speed and clocks depending on how you config it.
It would be *nice/wish* to add some of these features in future versions, so there is at least one plasmoid out there which can both display and adjust/overclock settings in catalyst on the fly.
Thank you for the "aticonfig --pplib-cmd 'get fanspeed 0'" line, it made it quite easy for me to add the fanspeed monitor. Yep, adding ' chars to popen was a pain in the... process. Btw it's much simplier than what we thinkd. :)
It's possible to change clocks with aticonfig, but i think it's not up to this simple monitor widget. And OC can be dangerous for less experienced people. :)
But i will think about this possibility.
About the git repo, i'm not sure. I'm still just an updater of this code, not it's original writer. For now, i think it's good enough if you send me a link to pastebin.com, if you doing something with the code.
Something always broken in *buntu. :)
Btw i'm in Chakra and we currently have only KDE 4.12.4 so currently i can not debug the problem with 4.13.
But you can send me some useful info if starting the script with a plasma monitor. Like this way in terminal:
plasma-windowed pyCatalystmonitor
That's may be enough to solve your problem.
Thanks for your rapid response, and the way to repair it. Here is the result:
Quote:
QDBusConnection: session D-Bus connection created before QCoreApplication. Application may misbehave.
QDBusConnection: session D-Bus connection created before QCoreApplication. Application may misbehave.
Bus::open: Can not get ibus-daemon's address.
IBusInputContext::createInputContext: no connection to ibus-daemon


Ratings & Comments
29 Comments
As I'm overclocking my card I really needed to make sure the fan was operating at an appropriate speed. Now I have a really nice visual indication of exacty what the gfx card is doing all the time. I can't thank you enough :)
I'm glay you are happy :) Currently I'm thinking about the display of vram usage, but i can't find any means to do this. Catalyst can't supply this information by itself and withouth catalyst, it may be impossible to do. If you have an idea about this... :)
So far I've found nothing in aticonfig can do that will help us display vram, so this one will be a little tricky! However! We can query the info we need with: lspci -v | grep VGA -A12 However on my system it reports: Memory at d0000000 (64-bit, prefetchable) [size=256M] So either I got ripped off by ASUS and they sold be a 256M card badged as a 1GB card, or lspci is misreading the info. (Probably I have 4x blocks of 256) I will keep digging, I'm sure there is a way to do this. The 14.10 driver from their website using catalyst control centre displays it, along with the type, clock and bandwidth, so there *is* a way and they use it. We just need to work how!
OK I have a solution. But it may not be totaly reliable as it involves greping the Xorg.0.log file, which might be unreliable for some people...: grep -i 'Video ram' Xorg.0.log Returns: [ 20.182] (--) fglrx(0): Video RAM: 1048576 kByte, Type: GDDR5 So as long as they log it. We can use it. Give it a try on your system and let me know if you think its a reliable enough method for us to use.
As for getting a dynamic update of vram in use, I'm still working on it :)
Well, lspci reads some "directly mapped to cpu" vram, that's why it is display 256MB. So it's correct, just not usefull to us. But total vram can be questioned from other sources like xorg. There may be a way for getting dynamic usage with c code, but it's not tested yet.
Yeah I see what you mean about lspci. I found this quote from a guy on an overclocking forum which explains the problem better than I can. Source: http://www.techpowerup.com/forums/threads/hmm-ati-hd5xxx-memory-usage-monitor-not-possible.127140/ ----------------------- cadaveca "Data in mem is "in flight" and as such, is not "actively" stored in mem. It requires the use of debugging tools(GPUPerfMonitor et al./virtualiztion of the app, sometimes), or custom code to find out how much is actually being used( for example, GTA4 bench will tell you % of memory was used). Also, you must be sure to not be querying the local store, which is just 32k. There basically is not one large 1GB data share on 1GB AMD cards. It's literally broken up into 4x256MB groupings(as the memory controller is not 256-bit, but 4x64 bit, but as they all run in tandem, it's considered 256-bit overall), making proper monitoring even more difficult. 4x data stores means it's very possible that monitoring calls may stall an app, leading to crashes. " --------------- So according to cadaveca it seems that just by monitoring we *might* cause some applications to stall and crash. I'm waaay out of my depth on this one :)
Just finished rebuilding my system. Just about to install your new version now, and will let you know how it goes. Well done for turning out some new code so fast :)
I couldn't find a repo.. Would be cool if it has/had one :)
Hi, A few questions please. Is there any sign of the original author yet? If he comes back do you plan to merge? I'd like to add a reading for the fan also, is this possible/difficult? Thanks for helping to make my desktop rock!
Hy! Thx! So far nothing from the authotor yet... "I'd like to add a reading for the fan also, is this possible/difficult?" If catalyst gives back that information in terminal, than it's possible to add. I will check this but not today.
Yep it does :) aticonfig --pplib-cmd 'get fanspeed 0' Fan speed query: Query Index: 0, Speed in percent Result: Fan Speed: 41% I've tried poking around with the code. I think I need to modify the getresult and updateTime functions. The fanspeed is reported as a percentage so I imagine the chart code there will be similar to the GPU Load one and I can re-use it for the fan?
Thank you, that looks promiseing! I hope i will have some free time before monday to implement this.
I'm a bit of a Python noob/learner but if I can find an IDE that works I'll try and help as much as possible! I've been using plasmate and it's preview is pretty buggy with python, so I will try kdevelop and see how that goes. I'm a bit stuck with how to pipe the aticonfig --pplib-cmd 'get fanspeed 0' command via Popen on line 172 and add it to the list in order to populate a chart. This is probably just a combination of my poor syntax escaping the quote marks 'get fanspeed 0' and/or plasmate just failing to reload the code in the preview window correctly each time I make a change. If I can work out how the original code loops through each iteration of aticonfig and then parses the results it should then be fairly simple to add a --pplib-cmd iteration that we can use in an additional chart, either above or below the GPU Temp area. Additionaly aticonfig --pplib-cmd can be used to set values i.e core clock speed at low,mid,high and the fan speed itself programaticaly. I belive http://sourceforge.net/projects/amdovdrvctrl/ uses this method to dynamicaly adjust the fan speed and clocks depending on how you config it. It would be *nice/wish* to add some of these features in future versions, so there is at least one plasmoid out there which can both display and adjust/overclock settings in catalyst on the fly.
Thank you for the "aticonfig --pplib-cmd 'get fanspeed 0'" line, it made it quite easy for me to add the fanspeed monitor. Yep, adding ' chars to popen was a pain in the... process. Btw it's much simplier than what we thinkd. :) It's possible to change clocks with aticonfig, but i think it's not up to this simple monitor widget. And OC can be dangerous for less experienced people. :) But i will think about this possibility. About the git repo, i'm not sure. I'm still just an updater of this code, not it's original writer. For now, i think it's good enough if you send me a link to pastebin.com, if you doing something with the code.
Fail at the initialisation script, impossible to create the object
Something always broken in *buntu. :) Btw i'm in Chakra and we currently have only KDE 4.12.4 so currently i can not debug the problem with 4.13. But you can send me some useful info if starting the script with a plasma monitor. Like this way in terminal: plasma-windowed pyCatalystmonitor That's may be enough to solve your problem.
Thanks for your rapid response, and the way to repair it. Here is the result: Quote:QDBusConnection: session D-Bus connection created before QCoreApplication. Application may misbehave.
QDBusConnection: session D-Bus connection created before QCoreApplication. Application may misbehave.
Bus::open: Can not get ibus-daemon's address.
IBusInputContext::createInputContext: no connection to ibus-daemon
Well, i found no connection between this log and the code. It seems like you have to waite until i get kde 4.13, it's in testing area for Chakra.
Ok, don't worry about that. I don't know if it's a kde bug, but it's the same as https://bugs.launchpad.net/ubuntu/+source/kde4libs/+bug/959151?comments=all
Well, yesterday Chakra got KDE 4.13 but the script works withouth any problems. So it must be some Kubuntu related issue.
I've tried again. And it's working ! Maybe a Kubuntu's update. Thank's for wrote it. Cheers
But I had to rename the .zip in .plasmoid
Thank you of nice plasmoid. Working fine with the Kubuntu 13.10 / KDE 4.11.3.
Hello! Running 4.12 Beta (4.11.97). Hope this helps.