


Icon Tasks deb build
N00bun2


Source (link to git-repo or to original if based on someone elses unmodified work):
----------------------------------
0.3.2 : plasma-applet-waterwatcher
* Add UI: added "Any County" and "Any Agency" filters to site search dialog.
* Add UI: net_error dialog now allows immediately retrying failed connections.
* BugFix: plasmoid remembers index of displayed timeseries between launches.
* BugFix: #17; fixed a crash occuring when switching between recent sources on unconfigured instances of the plasmoid.
----------------------------------
0.3.1 : plasma-applet-waterwatcher
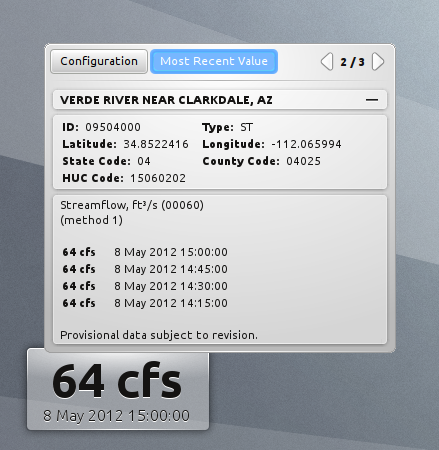
* Add UI: the "recent value" tab now displays up to the last four values.
* BugFix: #16; colors and theme SVGs used; info displays correctly with various themes.
* Engine: now requires plasma-dataengine-wateriv-0.3.1 (engine bugfix: #15).
----------------------------------
0.3.0 : plasma-applet-waterwatcher
* Add UI: a site info_panel that displays id, lat, lon, and other site codes.
* BugFix: issue 14; plasmoid supports multiple qualifiers per value.
* BugFix: issue 9; plasmoid keyboard shortcut toggles visibility of the dialog.
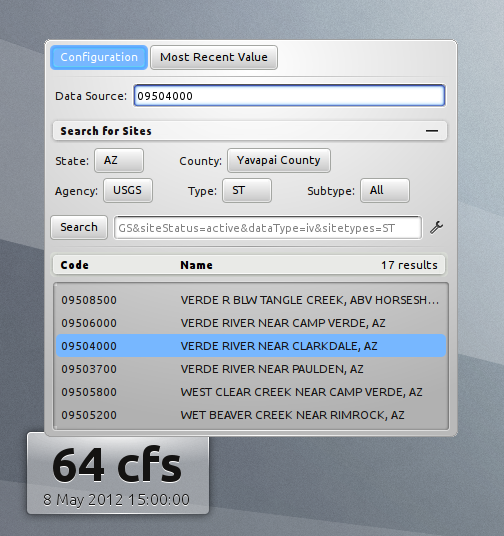
* Add UI: a filter panel that constructs valid site search queries; available search filters are state, county, agency, and site type.
* Add UI: a site search panel that interacts with the USGS Site Web Service.
* Engine: (optional) "site search" requires plasma-dataengine-watersites-0.1.0.
* Engine: now requires plasma-dataengine-wateriv-0.3.0 (engine rewrite).
----------------------------------
0.2.1 : plasma-applet-waterwatcher
* Add UI: the configuration tab remembers recent sources (last ten) and allows switching between them with the up / down keys.
* Add UI: a net_error indicator that is displayed next to values that are from cache; a net_error dialog that shows a more detailed error message.
* BugFix: display / retain cached values when update results in network error.
* BugFix: polling interval reads correctly from config (units are mins not ms).
* BugFix: engine updates are recognized immediately and not after next update.
* Engine: now requires plasma-dataengine-wateriv-0.2.1 (engine update bugfix).
----------------------------------
0.2.0 : plasma-applet-waterwatcher
* Add UI: a "configuration" tab that allows changing the data source and viewing errors when the engine rejects a data source.
* Add UI: a "recent value" tab that displays additional information and allows switching between data series with the mouse or arrow keys.
* Add UI: a tabbed dialog that is toggled on single click on the plasmoid.
* Mod UI: switching between data series now done with long click on plasmoid.
* Mod UI: improved error reporting; major refactoring of UI into components.
* BugFix: displays all values in a series instead of only first set.
* Engine: now requires plasma dataengine-wateriv-0.2.0.
----------------------------------
0.1.0 : plasma-applet-waterwatcher
* Basic configuration provided by plasmoid settings dialog.
* UI allows switching between returned values with single click.
* Initial release: a basic plasmoid that displays the most recent value.


Other Plasma 4 Extensions:


Ratings & Comments
4 Comments
Would it be possible to have it display the temperature in fahrenheit and river name on top?
I would love to see a version of this using data from http://levels.wkcc.org/ ..perhaps a version that uses his "Build your own levels" page that can pull his data & graphs into the plasma GUI (click on the water levels in the charts to see the graph)
I would love to see a version of this using data from http://levels.wkcc.org/ ..perhaps a version that uses his "Build your own levels" page that can pull his data & graphs into the plasma GUI (click on the water levels in the charts to see the graph)
This is definitely possible but after giving it some thought I don't think I am going to pursue it. I am pretty sure the majority of the data displayed at http://levels.wkcc.org/ comes from the same source used by the plasmoid, with the exception of the estimates for streams without gauges. There is also the issue of bandwidth. The plasmoid has the potential of using up a lot of it and I am not sure the boating club that runs the levels site would appreciate the traffic. Providing a nice interactive graph of the data is one my primary goals. Unfortunately a QML plot component isn't available and probably won't be until the release of Qt 5 (a year away). Until then I might try to provide some kind of static graph that is generated by the data engine but I don't think that is a very ideal solution. I am open to other suggestions for features, especially if they help make the plasmoid more useful for boaters.